US natural gas storage entered November above its seasonal average, but the national cushion masks a weaker position in the South Central region. The EIA report released on November 5 puts the focus on where gas is stored and how quickly it can reach buyers as winter demand develops.
The national surplus hides a regional gap
Working gas in the Lower 48 states reached 3,801 billion cubic feet for the week ending October 30. The weekly increase was 77 Bcf. Stocks stood 54 Bcf above the five year average, yet 109 Bcf below a year earlier, according to the EIA storage report.
South Central stocks were 1,208 Bcf, or 1.1% below their seasonal average. Within that region, salt storage held 296 Bcf against an average of 322 Bcf, a shortfall of 8.1%. Nonsalt stocks were 1.4% above average. Salt and nonsalt figures are components of the regional total, not additional inventories.
Why storage location and withdrawal speed matter
The EIA explains that salt caverns can inject and withdraw gas rapidly relative to their working capacity. Many are located along the Gulf Coast. The amount stored and the speed at which it can be delivered answer different questions.
The analytical implication is that a comfortable national total cannot establish that every local market has the same protection against a sudden demand surge. Gas must move through available pipelines, and the timing of withdrawals matters. Equally, the salt storage deficit does not establish an imminent shortage. It is one part of a balance that also includes production, incoming flows and consumption.
This release measures working gas inventories. It does not measure total reservoir capacity, forecast winter temperatures or prove that LNG exports caused the regional gap.
Three different exposures to the same gas balance
Henry Hub natural gas is the US spot benchmark in Louisiana, quoted in dollars per million British thermal units. A tighter regional balance could support nearby prices if demand rises faster than supply can respond. Mild weather and continued replenishment could instead reduce that pressure. Neither outcome is established by one weekly inventory report.
EQT Corporation, EQT on the NYSE, illustrates the producer exposure. Higher realised gas prices can support revenue, but regional price differences, transport costs and hedges affect what a producer receives. Its latest quarterly price reconciliation separates benchmark prices from those adjustments. A stronger Henry Hub benchmark is therefore not a direct forecast of EQT earnings.
Cheniere Energy, LNG on the NYSE, has a different exposure. It buys natural gas and converts it for export. Its business description emphasises contracted sales alongside marketing volumes. Higher feedgas costs do not translate into an equal decline in earnings because contract pricing and operating terms matter. Reliable supply and terminal operations remain distinct from the direction of the commodity price.
The next test is regional replenishment
Watch whether South Central salt stocks close their seasonal gap, alongside production, actual LNG feedgas demand and updated weather forecasts. A persistent gap accompanied by stronger demand would be more informative than the national total alone. A narrowing gap would weaken the case for sustained local tightness.
The EIA lists November 13 as the next storage release. Compare its observation period with October 30, rather than treating publication dates as inventory dates. For background, see our guide to supply, demand and the inventory buffer.
Published November 8, 2026. This analysis uses dated inventory estimates and does not report a current market quote or an observed price reaction.
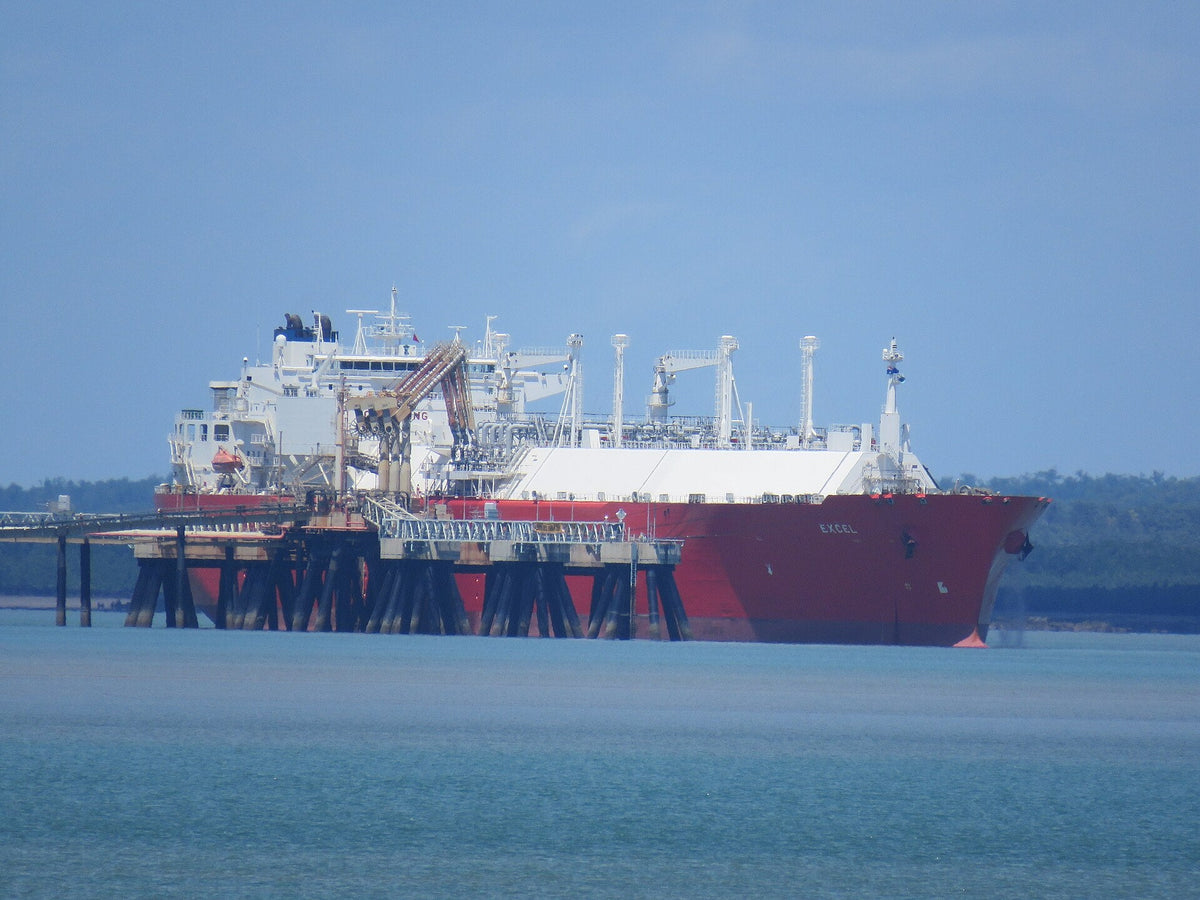
Archive photograph of LNG carrier Excel at Wickham Point, Australia, April 2016. Photograph by Ken Hodge via Wikimedia Commons, licensed under CC BY 2.0. Responsive previews may be resized or cropped. The image illustrates LNG shipping and does not depict US storage facilities or this reporting period.