

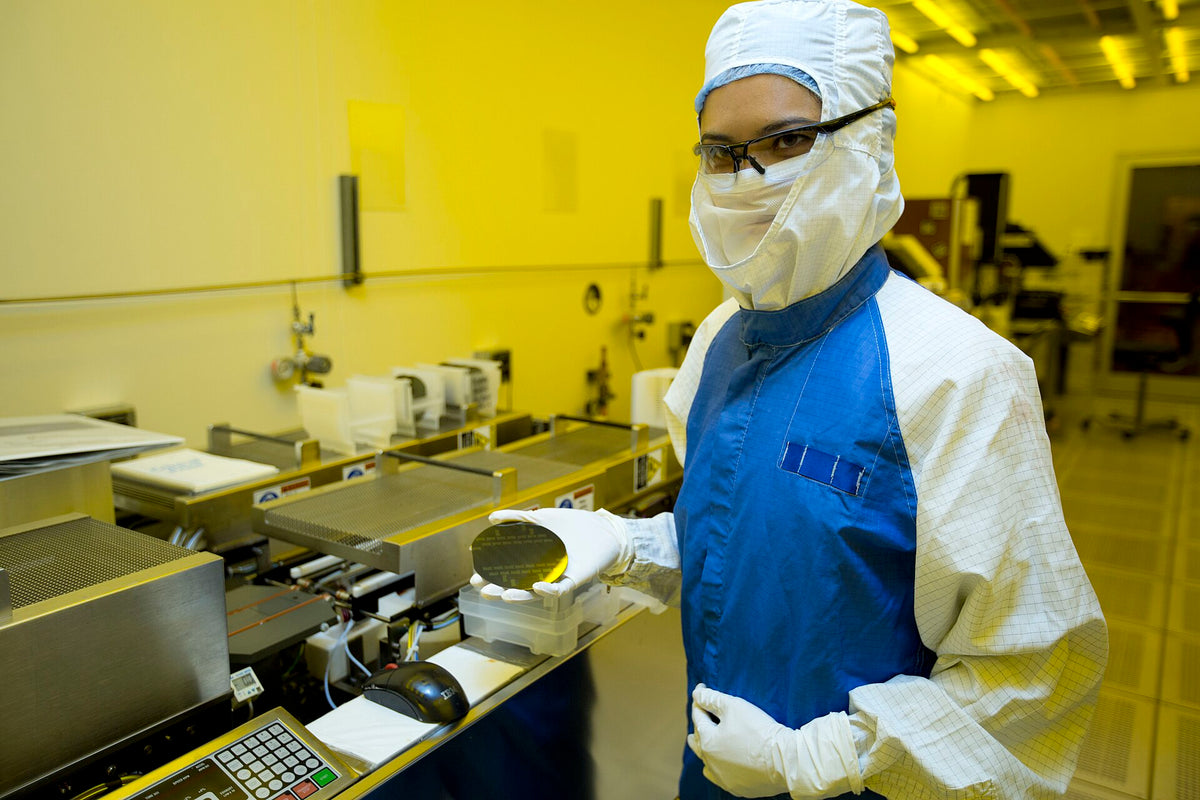
Illustrative file photo: A researcher with a silicon wafer at Lawrence Livermore National Laboratory, August 2013. Photo: U.S. Department of Energy via Wikimedia Commons. Public domain. Image previews may be cropped or resized.
The industry signal
The Semiconductor Industry Association reported on October 5 that worldwide semiconductor sales reached $159.7 billion in August 2026, up 8% from July. The release is an industry demand indicator. It is not a statement that every listed semiconductor company is growing at the same pace.
Reported context: Semiconductor Industry Association August sales release, October 5, 2026.
Where the economics differ
Chip designers depend on product competitiveness and access to manufacturing. Foundries must invest heavily in production capacity. Equipment suppliers depend on the timing of customer expansion, and component providers can face a different inventory cycle altogether.
Those differences matter when using an industry headline to assess a stock. Strong total sales can coexist with weak pricing in a particular product category or with expensive investment before new capacity earns an adequate return.
A better comparison within the sector
Group companies by what they sell and who buys it. Then compare revenue growth, gross margin, cash investment and inventory on a consistent basis. A manufacturer and a designer may both benefit from demand while producing very different amounts of cash for each dollar of sales.
Also distinguish pricing from unit demand. Higher sales value alone does not establish how many additional chips were shipped or whether higher prices will persist.
What this means for exposure
A portfolio of several semiconductor names may still rely on the same end customer spending cycle. Examine that common dependence before calling the holdings diversified. The industry release is a useful starting signal, but the investment case requires company evidence on margins, capital intensity and the price already paid for expected growth.
Sources and context
Analysis prepared on October 12, 2026. Figures and schedules refer to the dated company or industry announcements cited above. The questions and scenarios are FOLITIC analysis.


