

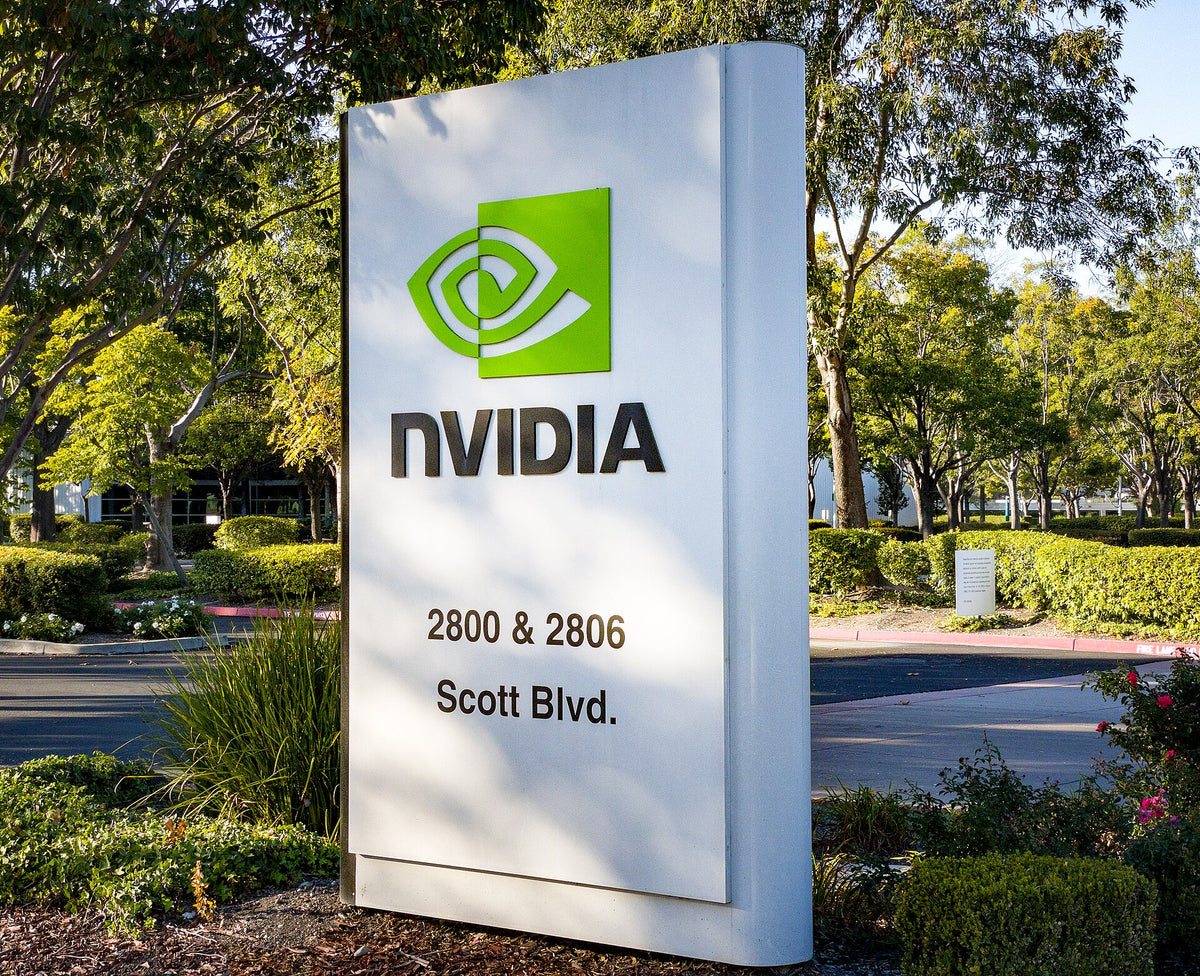
Illustrative file photo: NVIDIA headquarters campus in Santa Clara, California. Photo: Will Buckner via Wikimedia Commons. CC BY 2.0. Image previews may be cropped or resized.
Start with the business exposure
NVIDIA reported Data Center revenue of $89.0 billion in its fiscal second quarter 2027 release. That concentration makes infrastructure spending an important part of any valuation discussion. The size of the business does not by itself establish whether its shares are cheap or expensive.
Reported context: NVIDIA fiscal second quarter 2027 results, August 26, 2026.
Replace a single forecast with scenarios
A useful model should test several combinations of revenue growth and margin. Stronger demand with stable margins produces a different outcome from slower demand combined with price pressure. The purpose is to identify which assumptions account for most of the estimated value.
For example, in an illustrative business earning 50 units of profit on 100 units of revenue, a margin decline to 45% reduces profit to 45 even if revenue is unchanged. This is hypothetical arithmetic, not a forecast for NVIDIA.
Follow the capital behind the customer
Demand depends partly on customers' ability and willingness to keep investing. The distinction between equipment capability and the return customers earn using it matters. A technically attractive product can still face uneven purchasing when budgets or deployment schedules change.
Inventory, collection and purchase commitments can help assess the quality of growth. They should be interpreted in context, especially during product transitions, rather than treated as automatic warning signs.
What the framework can conclude
Compare a range of cash outcomes with an observed share price and a clearly dated share count before making a valuation claim. This article supplies the analytical framework, not a current price target. Rapid growth can support value, but the price paid determines how much of that future success a shareholder has already purchased.
Sources and context
Analysis prepared on October 12, 2026. Figures and schedules refer to the dated company or industry announcements cited above. The questions and scenarios are FOLITIC analysis.


