The FAO Cereal Price Index fell 4.5% in October 2026, while its rice price index rose 1.6%. The November 6 release points to an uneven easing of grain costs. Buyers still need to distinguish a lower international benchmark from the cost of securing the right crop at the right port.
FAO attributed softer wheat prices to weaker demand and improving production prospects, especially in Argentina. US harvesting and expected South American supplies weighed on maize. Rice moved the other way as delayed harvesting, adverse weather and higher costs supported quotations. These are monthly international price indicators, not retail food prices or individual futures returns. FAO price release.
More grain in storage does not guarantee easier imports
FAO's separate November supply assessment forecasts global cereal production of 2,999 million tonnes in 2026 and trade of 507.7 million tonnes in 2026/27, down 3.3% from the previous season. It expects cereal stocks to rise 1.8% by the close of seasons in 2027, partly because export disruptions leave wheat accumulating in Russia and Ukraine.
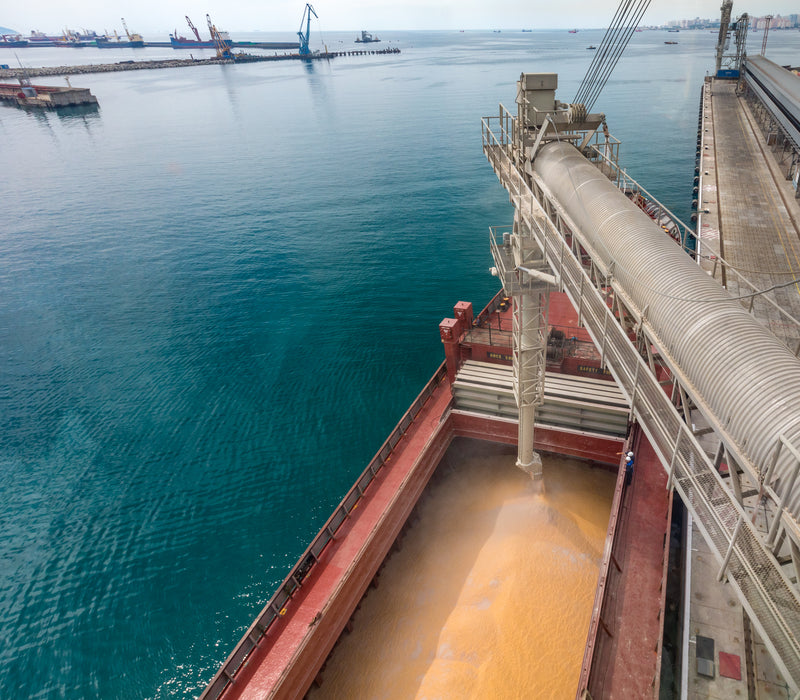
That combination matters. Grain held behind a transport constraint can increase the global inventory total without improving a distant buyer's delivery options. The relevant test is whether export offers, loading capacity and freight costs improve together.
FAO projects wheat trade to fall 8.6%, while maize trade rises 2.2%. Rice production, expressed as milled rice, is forecast at 552.0 million tonnes against utilization of 558.8 million tonnes in 2026/27. Existing inventories cushion that imbalance. Production, seasonal use and trade must retain their respective reporting periods. FAO supply and demand brief.
Three markets to follow separately
- Corn links the supply story to feed and ethanol demand. Its FOLITIC reference is a physical cash bid at Minneapolis terminal elevators in dollars per bushel. It does not represent a global maize price.
- Hard red winter wheat offers a specific wheat reference from North Central Colorado. Grade, protein and destination still matter when comparing it with an import tender.
- Long grain white rice covers a US milled rice reference at Arkansas mills in dollars per 100 pounds. It is distinct from paddy rice and from FAO's international rice index.
Check the observation date on each page. Older or unavailable readings should not be treated as current offers. The crop weight converter helps reconcile quantity units, but cannot remove differences in quality or delivery terms.
The margin question for producers and food businesses
For a grower, a lower selling price can offset the benefit of a larger harvest. For a miller or feed buyer, cheaper grain can improve margins only if procurement costs fall faster than selling prices and other expenses. Existing contracts and inventory delay that adjustment.
Trading and handling businesses face a different test. A rerouted cargo may create activity on one corridor while leaving another underused. Higher storage volumes are not sufficient evidence of stronger profit if financing and operating costs rise as well.
For importers, compare the same grade delivered to the same destination in the same currency. A weaker local currency or higher freight bill can absorb a decline in the dollar benchmark. This is a conditional transmission mechanism, not evidence that every buyer has already received relief.
What would change the assessment
If harvests progress and export routes become more reliable, competition among origins could make the price decline more accessible to buyers. If loading constraints persist, global stocks could remain comfortable while particular destinations pay more for dependable delivery. In rice, the distinction between a delayed harvest and a lasting production loss will shape how persistent the pressure becomes.
The next near term checks are USDA Crop Progress on November 9 at 4 p.m. Eastern Time and Crop Production on November 10 at noon Eastern Time, according to the NASS calendar. CME's USDA report calendar also lists WASDE for November 10 at noon Eastern Time. Compare revisions within the same marketing year before drawing a price conclusion.
For the method behind those comparisons, see how to read commodity reports.
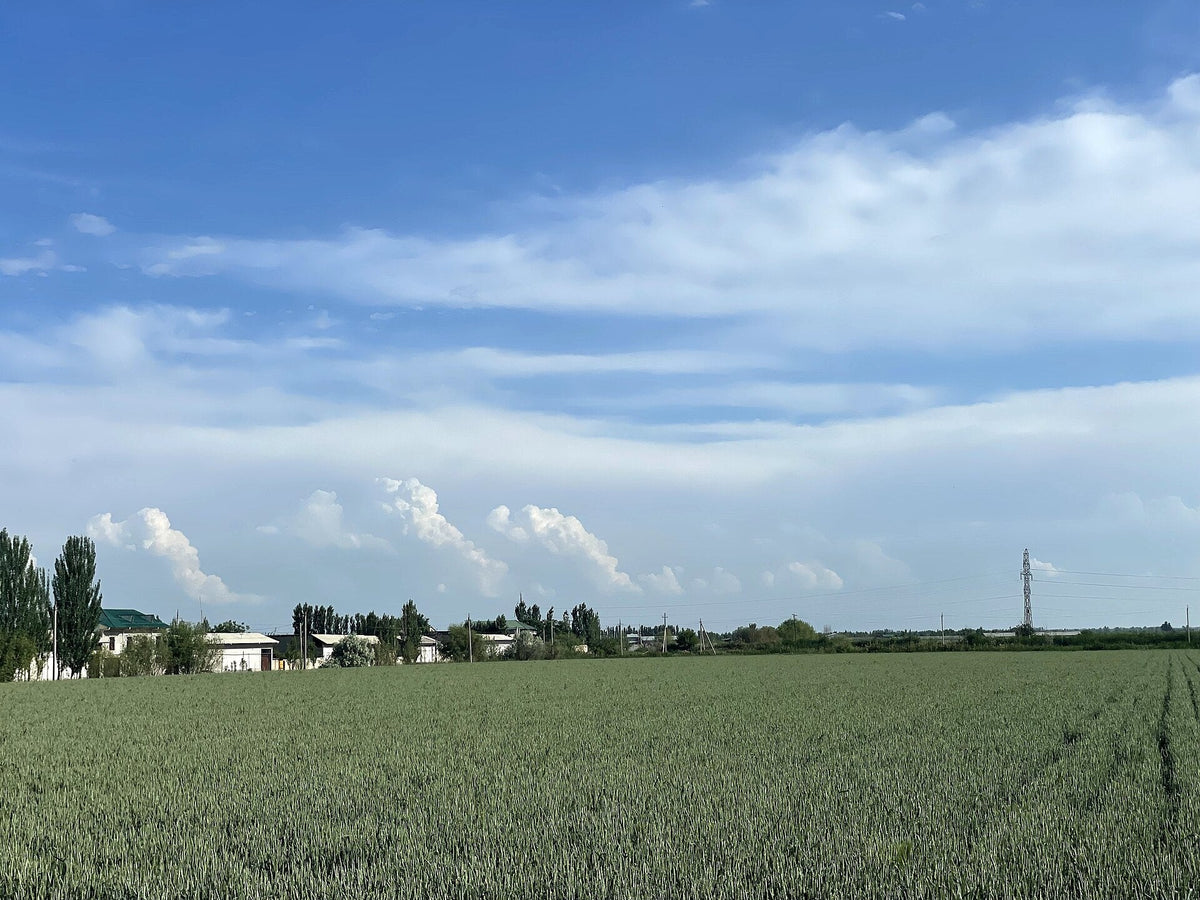
Illustrative archive photograph of wheat fields in Namangan, Uzbekistan, on May 6, 2024. Photograph by Usmonov Gayrat via Wikimedia Commons, dedicated to the public domain under CC0 1.0. It does not depict the current harvest discussed here.