Research and Trade Management · Futures Trading Guide
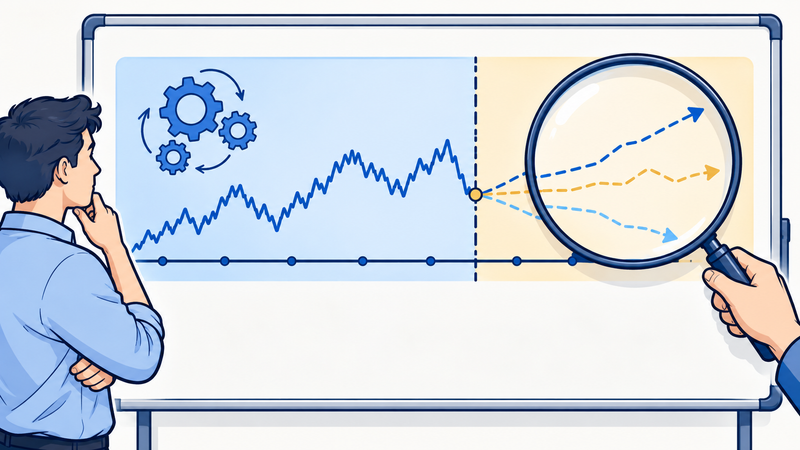
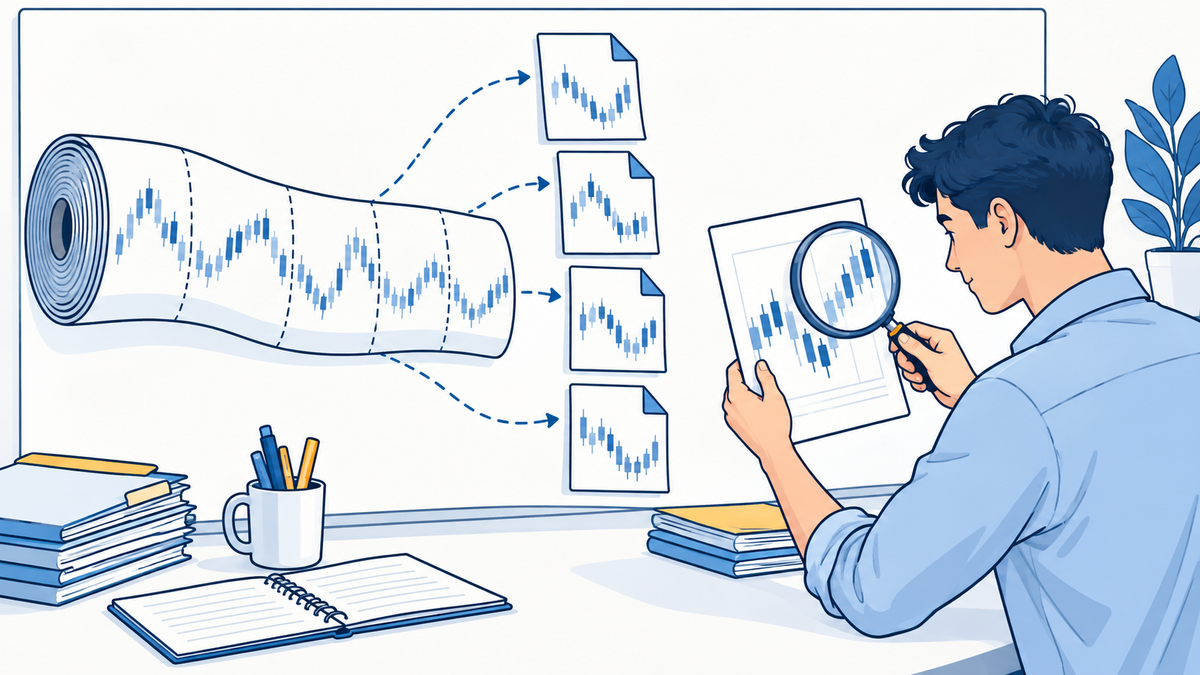
A continuous chart is a research construction. Testing a futures strategy requires knowing which contract could actually have been traded at each decision.
Keep a record of the traded contract
Store the exchange, symbol, maturity, multiplier and session for each simulated position. A continuous series joins successive contracts under a chosen roll rule. Unadjusted series can contain price gaps at switches, while adjusted series change historical levels. Neither should be assumed to reproduce executable historical prices without checking its construction.
Separate a roll gap from a trading gain
Suppose an old contract trades at 100 and the replacement at 103 on the roll date. A continuous chart that jumps from one to the other displays three extra points. A trader cannot collect those points merely by switching contracts. The simulation must close the old contract and enter the new one at their respective executable prices, then track subsequent changes and costs.
Respect information availability
A volume based roll rule must use volume information available at the decision time. Economic releases need their original publication timestamps rather than later revised values. Avoid selecting a contract using the full day’s volume and then claiming an earlier fill. Include delisted products, changed specifications and missing data where they affect the tested universe.
Model execution at the required resolution
Daily bars may be insufficient when a stop and target both fall inside the same bar. Without a reliable intrabar sequence, disclose the ambiguity and use conservative assumptions or finer data. Include bid and ask friction, commissions, realistic order delays and roll trades. Save a versioned dataset and a complete trade ledger so another reader can reproduce the result.
Try it yourself
An adjusted continuous series changes old prices after a new roll. Should its historical adjusted level automatically be used as a real fill?
Show the worked answer
No. Use the actual listed contract’s historical executable prices for fills and cash results. Document how the adjusted series is used to calculate signals.
Further reading
- TradingView: Continuous futures back adjustment
- CME Group: Expiration and contract rolls
- Bailey and coauthors: The probability of backtest overfitting
Educational material. Prices, margins and strategy examples are hypothetical unless explicitly identified as contract specifications. They are not trade recommendations. Futures losses can exceed deposited collateral. Product terms and eligibility vary by venue and jurisdiction.