Reading Futures Markets · Futures Trading Guide
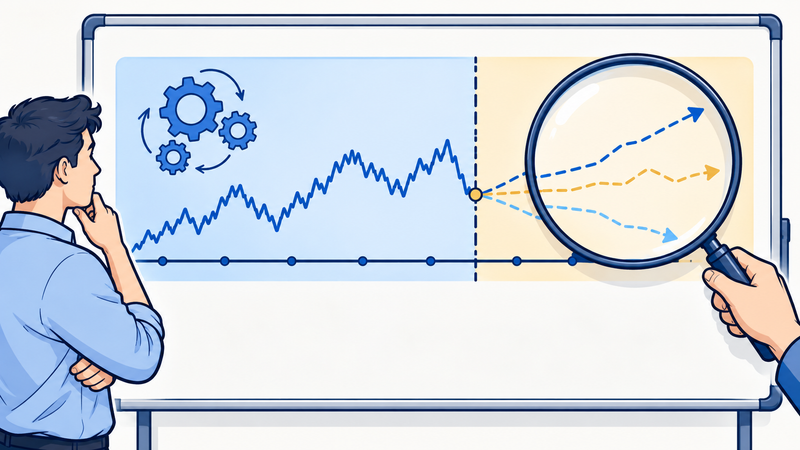
Charts can organise price behaviour, but indicators are transformations of data rather than independent guarantees. Define the calculation and the decision it supports.
Describe structure before naming a pattern
Record whether recent highs and lows are rising, falling or overlapping. Mark zones established by a rule rather than drawing the most convincing lines after the result. A previous high can become a useful reference, but orders and liquidity determine whether price holds there. Treat a failed level as new information, not as an obligation for the market to reverse.
Measure movement in the same units
True range is the largest of the current high minus low, the absolute high minus previous close, and the absolute low minus previous close. Average true range smooths this measure over a defined period. It describes recent movement and includes gaps, but is not a maximum loss estimate. Multiply an ATR measured in points by the contract multiplier to translate it into cash exposure.
Calculate a simple VWAP
Volume weighted average price equals the sum of trade price multiplied by trade volume, divided by total volume. Suppose two trades occur at 100 for two contracts and 102 for three contracts. VWAP is 506 divided by 5, or 101.20. A charting platform may approximate this with bar data. Session start and reset rules change the result, so compare like definitions.
Make the indicator testable
Specify the contract series, session, bar interval and data treatment. A moving average on an adjusted continuous chart can differ from one on the current maturity. Combining several indicators derived from the same prices does not automatically create independent confirmation. Write the entry, invalidation and execution assumptions first, then test them on unseen periods and after costs. Use indicators to express a question that can fail, rather than to certify a trade.
Try it yourself
A fictional future has ATR of 12 points and a $5 multiplier. What cash movement does one ATR represent for three contracts?
Show the worked answer
12 × $5 × 3 equals $180. This is a historical movement scale, not a guaranteed stop fill or maximum loss.
Further reading
- CME Group: Support and resistance
- Fidelity: Average True Range
- Interactive Brokers: Volume weighted average price
Educational material. Prices, margins and strategy examples are hypothetical unless explicitly identified as contract specifications. They are not trade recommendations. Futures losses can exceed deposited collateral. Product terms and eligibility vary by venue and jurisdiction.
Continue learning
- Previous lesson: Building a futures macro and supply calendar
- Next lesson: Market limit stop and stop limit orders
- Explore all Futures Trading Guide lessons