Britain's planned gilt sales on November 11 and 12, 2026 offer a practical test for income comparisons. The securities have annual coupons of 0.125% and 4.125%. That difference determines cash interest per unit of face value. It does not establish which security offers the higher investment return.
Two sales with different cash flow profiles
The Debt Management Office's November 6 announcement schedules a tender of up to £1 billion nominal of the 0⅛% Treasury Gilt 2028, GB00BMBL1G81, for November 11. Bidding runs from 9am to 10am London time, with settlement planned for November 12. The amount is a ceiling, not a completed sale.
A separate November 5 notice schedules a £4 billion auction of the 4⅛% Treasury Gilt 2033, GB00BVP99780, for November 12. It matures on March 7, 2033 and pays interest on March 7 and September 7. Settlement is scheduled for November 13. Both securities are sterling government obligations.
Equal face value is not equal money invested
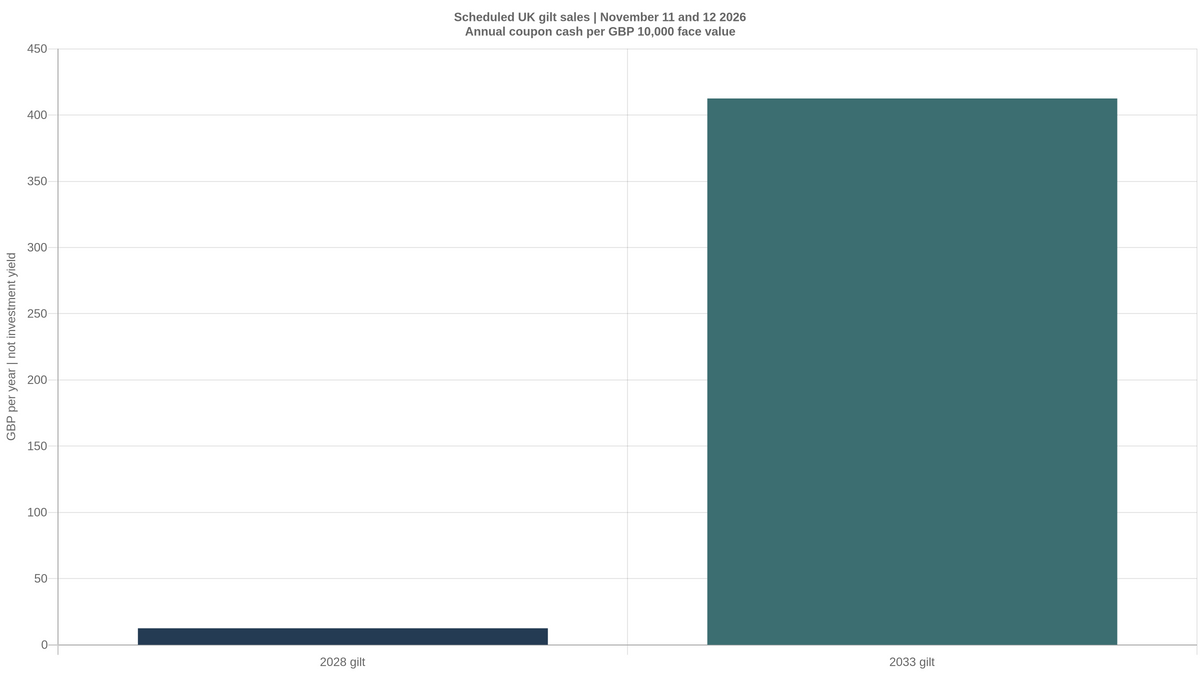
For an illustrative £10,000 nominal holding, a full year's contractual coupon is £12.50 for the 2028 gilt and £412.50 for the 2033 gilt, before tax and costs. These calculations multiply face value by the stated annual coupon. They are not purchase yields, expected returns or the cash that a new buyer would necessarily receive during the next twelve months.
The comparison deliberately holds face value constant. The cash needed to acquire that face value depends on the market price and accrued interest. A purchase below redemption value can produce a capital gain if held to redemption and paid as promised. A purchase above redemption value creates the opposite arithmetic. Coupon income alone leaves that component out.
A yield to maturity calculation incorporates the purchase price and promised cash flows. Realising that compound return also depends on coupon reinvestment and holding assumptions. Selling earlier introduces an unknown exit price. Neither scheduled sale yet supplies a verified auction yield in this analysis, so the coupon gap cannot support a ranking of the two investments.
The portfolio question is when cash is needed
A lower coupon places more weight on the purchase and redemption prices when evaluating return. A higher coupon delivers more recurring cash per unit of face value, but that cash must be spent or reinvested. If future reinvestment rates fall, the realised compound outcome can differ from the yield calculated at purchase.
Maturity adds a separate risk. A longer stream of fixed cash flows generally has more exposure to changing required yields, other things equal. Exact modified duration requires the relevant price, yield and cash flow schedule. Maturity is not a substitute for that calculation, and this article assigns neither gilt an estimated duration.
For a sterling spending objective, the analysis starts with dated cash obligations and the ability to hold through price changes. For spending in another currency, exchange rate movements or hedging costs add another layer. Fixed sterling payments also leave purchasing power exposed to inflation. These are general research considerations, not a personalised allocation.
What the results can resolve
The tender and auction results will provide actual allocations and pricing terms. A subsequent comparison should use consistent settlement dates, accrued interest treatment and yield conventions. It should then separate cash income, redemption value and market price risk. A larger coupon is visible immediately. A better fit for a portfolio requires those additional tests.
Original FOLITIC illustration calculated from DMO coupon terms announced November 5 and 6, 2026. Values show gross annual coupon cash per £10,000 face value, not yields or equal cash investments. No live prices are shown.