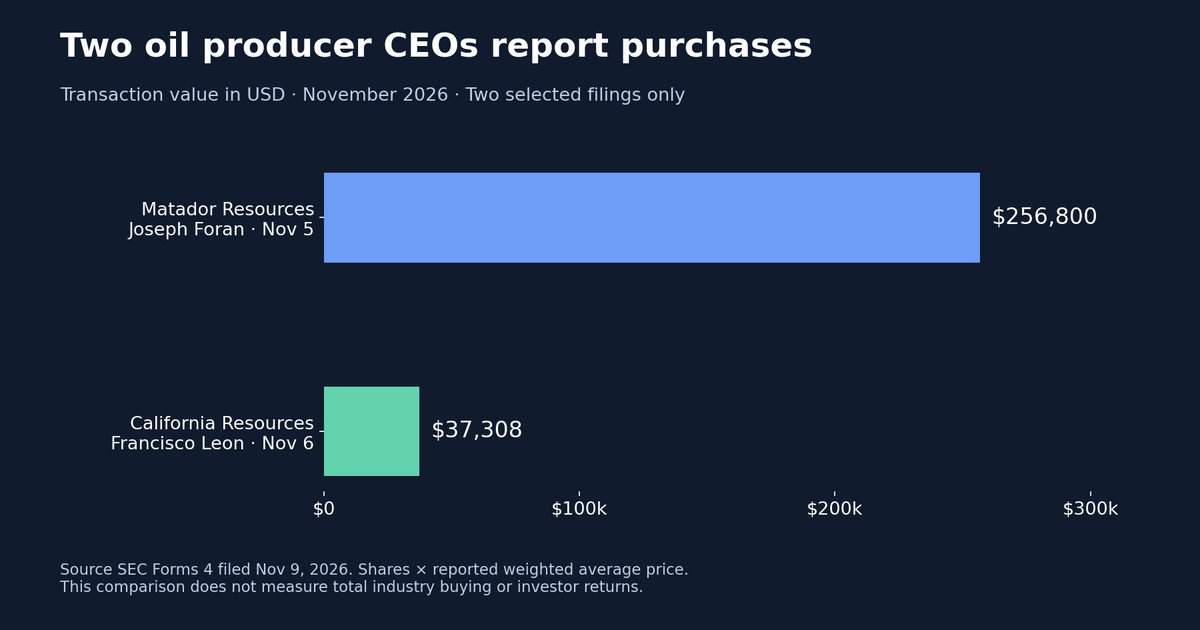
Matador Resources chairman and CEO Joseph Foran and California Resources president and CEO Francisco Leon disclosed share purchases in Forms 4 filed on November 9, 2026. Together, the two selected purchase rows represent approximately $294,108 in new share exposure. Their ownership footnotes, however, show why a simple ranking by the percentage increase in holdings can mislead.
This is a comparison of two CEOs at two US oil and gas producers, using transactions dated November 5 and 6. It is a deliberately narrow case study, selected for comparable executive roles and nearby transaction dates. It is not a census of either company's insiders or of the exploration and production industry.
What the two disclosures show
| Measure | Matador Resources | California Resources |
|---|---|---|
| Reporting person | Joseph Foran | Francisco Leon |
| Transaction date | November 5, 2026 | November 6, 2026 |
| Common shares purchased | 5,000 | 800 |
| Reported average price in USD | $51.36 | $46.6348 |
| Calculated gross purchase value | $256,800 | $37,307.84 |
| Direct shares after the purchase | 9,772 | 333,177 |
Both filings use transaction code P for the common stock purchases. Each reports a weighted average across multiple executions, so these are two reported transaction rows rather than two individual market fills. Neither filing marks the transaction as intended to satisfy the Rule 10b5-1 affirmative defense conditions. The reported prices are historical execution averages, not current market quotes.
Foran's purchases ranged from $51.17 to $51.55. Leon's ranged from $46.52 to $46.75. Multiplying shares by the reported averages produces the values above, before any separately charged costs. Foran accounts for about 87% of the combined purchase value in this selected pair. That concentration describes the sample, not industry demand.
The denominator changes the apparent signal
Foran's purchase more than doubles the direct holding shown on his transaction row, from an arithmetically implied 4,772 shares to 9,772. But treating that as a doubling of his entire economic exposure would be wrong. His filing contains 13 additional indirect holding rows covering family partnerships and trusts. The footnotes also qualify beneficial ownership according to his pecuniary interest. The direct balance includes shares obtained through an employee stock purchase plan.
Leon reports 333,177 direct shares after buying 800. Relative to the implied preceding direct balance of 332,377, the purchase adds approximately 0.24%. That direct holding comparison is much smaller than Foran's, but the two percentages do not measure the same fraction of total wealth or total economic exposure. Neither disclosure supplies a complete personal balance sheet.
The useful comparison is therefore the disclosed cash commitment, ownership form and executive participation together. Ranking conviction solely by the change in one direct ownership row would give a distorted result.
A shared industry does not mean identical risk
Matador describes a business centered on US oil and gas development, especially the Delaware Basin, alongside midstream operations. California Resources combines energy production with a carbon management business. Their company profiles support placing them within a broad energy producer comparison, while also showing why their operating and regulatory exposures differ.
For shareholders, these purchases add evidence of executive participation in equity risk. They do not change reserves, production economics, debt obligations or the cash available for distributions. An investment assessment still needs company cash flow, capital spending and commodity price assumptions. The filings do not establish that either CEO expects a particular oil price or share price.
What would strengthen a broader industry reading
A wider conclusion would require a predefined company universe, a consistent transaction window and a review of purchases and sales by all relevant insiders. Grants, option exercises, tax withholding and transfers would need separate treatment. Repeated purchases by different people would also need to be distinguished from multiple executions by one person.
Here the count is two companies, two people and two purchase rows. There are no sales in these two selected forms, but that is not evidence of zero selling across the companies or industry. No industry net buying estimate or market reaction is inferred. Further disclosures may broaden or contradict this small observation.
Sources and method
The comparison uses the complete Matador Form 4 and California Resources Form 4, including all ownership footnotes, and the Matador and California Resources company profiles. Values are in US dollars. The original FOLITIC chart compares these selected disclosures only.