

The Bank of England's market survey published on 6 November shows that participants had already expected the UK rate increase delivered a day earlier. For EUR/GBP, that shifts the analytical question toward what could change the next decisions in Britain and the euro area, rather than treating the larger policy gap as a fresh currency signal.
A published survey with an earlier information date
The survey collected responses from 80 participants between 21 and 23 October. The median of their most likely Bank Rate expectations was 4% for November and December, then 4.25% for February 2027. Its publication date does not make it a survey of views after the decision.
That distinction matters. The results support the conclusion that an increase was anticipated within this sample. They do not measure current market pricing, establish a probability for the next meeting or prove how much of the decision was reflected in EUR/GBP.
The gap widened, but the instruments are different
The Bank of England raised Bank Rate from 3.75% to 4% on 5 November. Eight members backed that increase and one preferred 4.25%. The bank described greater inflation pressure from energy while noting limited evidence so far of wider effects on wages and other prices.
The ECB held its deposit facility rate at 2.50% on 29 October. It also faced an energy shock, but reported broadly stable underlying inflation and no material wage response at that stage. Neither institution committed to a fixed future path.
Subtracting the ECB deposit rate from Bank Rate gives 1.50 percentage points, compared with 1.25 before the UK decision. These are different policy instruments, not equivalent investments. The difference is neither a bond yield spread nor an available return on a currency position. Financing, hedging and exchange rate changes can alter the outcome.
What the reference rates actually show
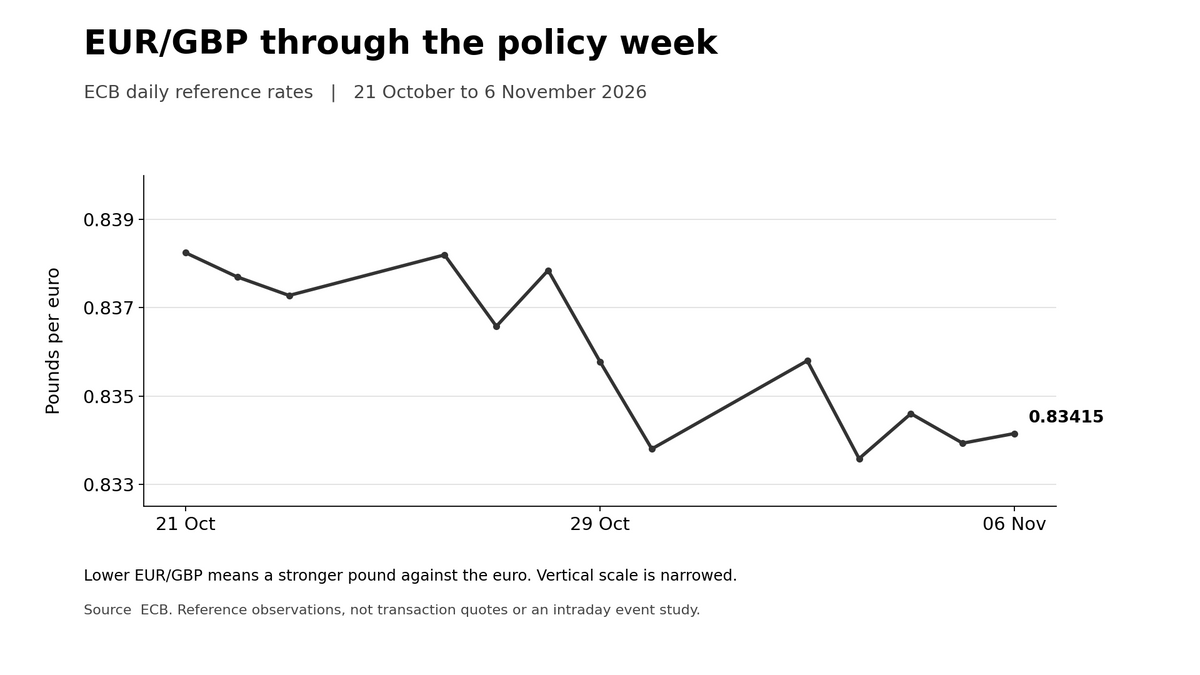
EUR/GBP means pounds per euro. A lower reading indicates a stronger pound against the euro. The ECB reference moved from 0.83580 on 2 November to 0.83415 on 6 November, a decline of about 0.20% calculated between those dated observations.
The 6 November reading was slightly above 5 November's 0.83393. That is not an intraday reaction study and does not establish the effect of the UK decision. These are ECB information reference rates, usually published around 16.00 CET, not transaction quotes. No November 9 spot price or change over the latest 24 hours is asserted here.
Both economies can change the comparison
The next near term test is activity. The UK first estimate for third quarter GDP is scheduled for 12 November at 07.00 GMT. Eurostat's next third quarter estimate follows on 13 November. Its preliminary euro area reading was a seasonally adjusted quarterly increase of 0.4%.
As a conditional interpretation, resilient UK activity alongside weaker euro area demand could sustain expectations of relatively tighter British policy and support sterling. Weaker British activity or stronger euro area inflation persistence could undermine that case. Similar surprises on both sides may change the relative outlook much less. These scenarios carry no numerical probabilities or exchange rate targets.
The releases describe an earlier quarter. They cannot measure the economic effects of November's UK increase. Compare quarterly volume measures and revisions, rather than matching a British monthly figure against a euro area quarterly figure.
Translate the move into the actual exposure
A stronger pound can reduce the sterling cost of a fixed euro invoice for a UK importer, while reducing the sterling value of fixed euro receipts. Existing hedges, contract currencies and costs determine the net effect. A euro based holder of a sterling asset also faces currency translation separately from the asset's local return.
FOLITIC's conversion cost estimate lets readers examine charges using stated assumptions. The guide to interest rate expectations explains the comparison between the two policy paths. The question for the next releases is whether they change that comparison enough to matter after costs and existing expectations.
Analysis dated 9 November 2026. Original chart prepared for this article from ECB daily reference observations between 21 October and 6 November. The vertical scale is narrowed to show variation. The chart is not evidence of causation or an executable market quote.


