

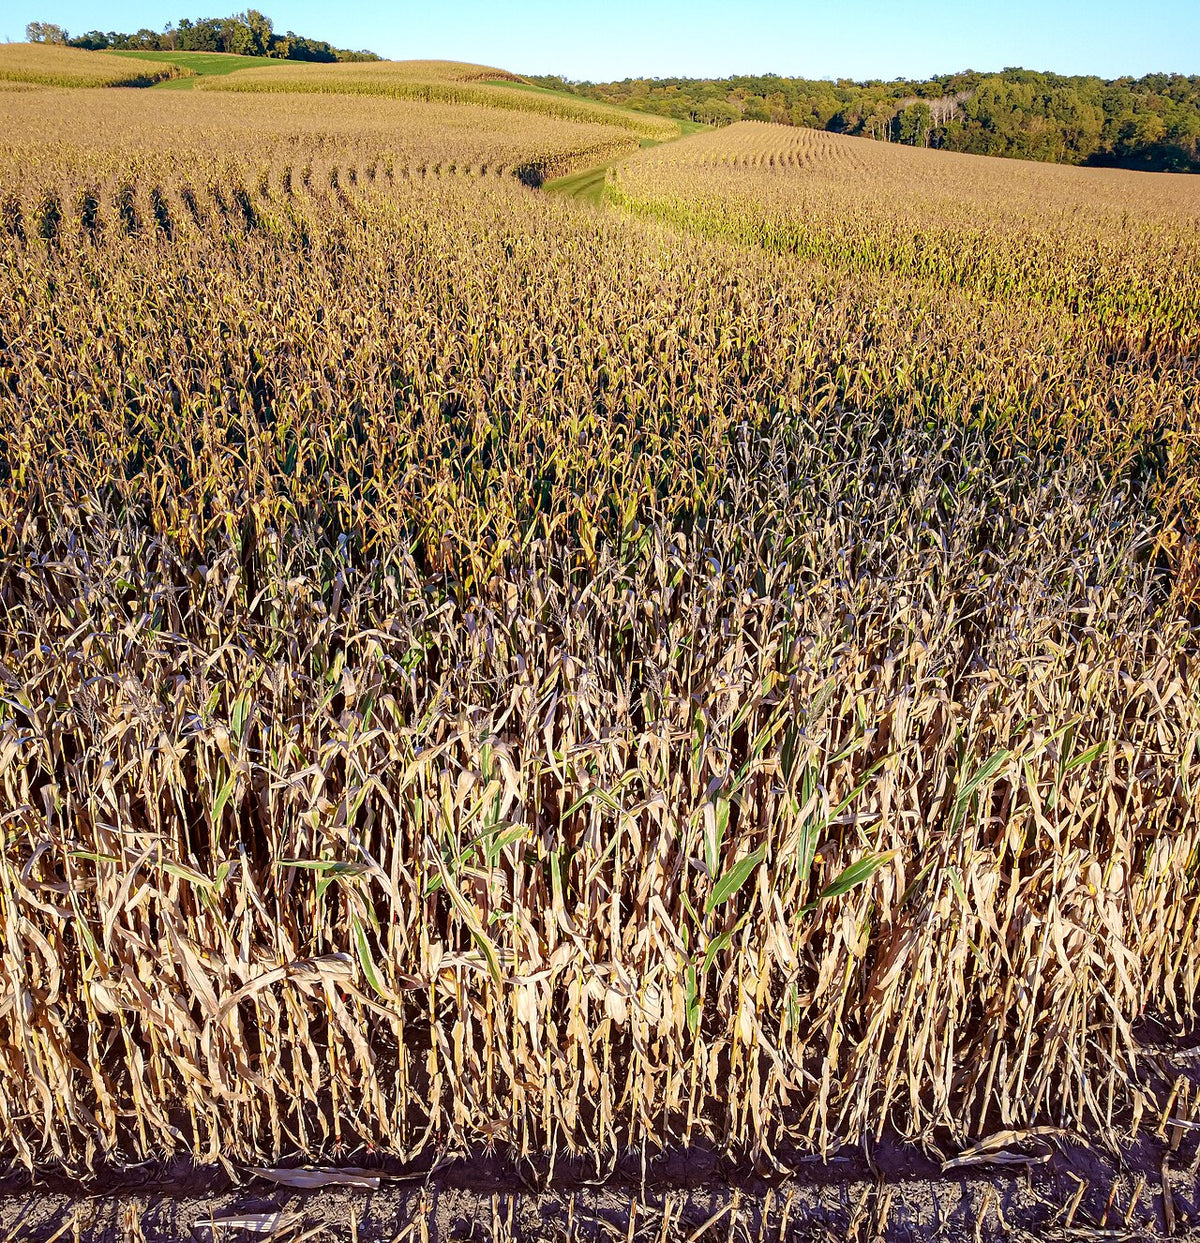
Corn field in Wisconsin, September 2024. Photo: Wikideas1, via Wikimedia Commons, CC0 1.0. Historical file photograph, not a record of the 2026 harvest.
What happened
U.S. corn stocks from the previous crop stood at 2.10 billion bushels on September 1, 2026, up 35% from a year earlier. Soybean stocks fell 3% over the same period, according to the USDA’s Grain Stocks release on September 30.
The corn total included 787 million bushels on farms and 1.31 billion elsewhere. The report measures inventories on a specific date. It is not a forecast of the size of the next harvest.
Why it matters for investors
FOLITIC reading: The contrast makes it risky to treat all crop markets as one trade. A larger corn buffer and a smaller soybean buffer describe different starting points, even when both appear in the same agricultural portfolio.
More inventory can cushion a supply interruption, but the headline percentage does not reveal whether the market expected an even larger increase. Price reactions depend on that comparison as well as on future demand. A stocks release by itself is therefore not enough to label a commodity a buying or selling opportunity.
What to watch next
Read the inventory snapshot alongside harvest estimates and export demand. For a fund, check which crops it actually holds and how concentrated its exposure is. For a business, consider whether it sells crops, processes them or purchases them as an input. The same change in grain prices can affect those activities differently.
Keep the dates distinct when comparing reports. These figures describe September 1 stocks, not current warehouse balances or the October crop forecast.
Source
USDA NASS, September 2026 Grain Stocks release, published September 30, 2026. The interpretation above is FOLITIC’s own.


